Saturday, December 18, 2010
EURUSD: This Is What A Trending Market Looks Like
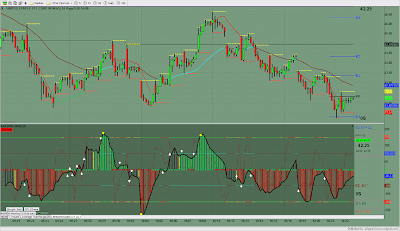
There is nothing more frustrating than trading in a range bound market such as the S&P 500 index whether it be the SPY or the ES futures. I do neither. Instead I trade the EURUSD forex pair which provides me with more trending days than range bound days. I use a 25 pips range bar (see chart) which reduces the noise that time charts are notorious for and gives me just the price action. Friday Dec. 17th was a textbook trending day which provided a clean 171 pips of easy money. The short signal was a swing high at 5:28 am (1.3316) on news of a Moody's downgrade of Ireland. It was time to cover on a swing low in the range bar at S2 support (1.3145) which equates to a 171 pips of profit.
Sunday, November 21, 2010
Market Scanner Ideas Working Well
Last week I used the eSignal Scanner...and it worked very well. Not surprising in this stock pickers market, where we are lucky to get 1 trending day per week. For the PreMarket Scan I look for stocks that have a minimum daily volume of 2 million share and trading at least 100k shares before the open. Last week there were at least 2 names each morning to concentrate on at the open. As long as they are outside of the previous day's range I will put the trade on with a stop loss using the hourly ATR (average true range). Last week they all played out well. On Monday I traded ABT and BIIB. Tuesday I had URBN and MON. Wednesday NOV and COH were good for nice winners. On Thursday NOV again as well as COH. Then Friday was a range bound day except for MRVL and PCX which were very nice winners. Above are the 5 minute charts that I used to day trade this past week.
Sunday, October 31, 2010
Using Range Bars to Day Trade Las Vegas Sands After Earnings
Day Trading LVS after they released their earnings last Wednesday was just a matter of fading the gap opening (46.05) on Thursday and then going long above the Thursday intra day resistance (45.00) on Friday morning. LVS was trading as high as 46.55 before Thursday open. When the opening bell rang and LVS could not take out the pre-market highs, it was just a matter of getting short on the first pullback after taking out the pre-market low of 44.93. My 1st sell short signal came at 9:52 am at 45.06 after trading below thw 44.93 level. The 2nd sell short signal came at 10:08 am at 44.95. The 3rd sell short signal came at 11:10 am at 44.76. The signal to cover the shorts were at 2:47 pm at 44.04. Friday morning after testing the Thursday morning resistance level it was time to go long. That signal came at 9:50 am at 44.90 and we were long on our trading desk....Ka Ching!
Labels:
day trading,
investing,
stock charts,
stock trading
Sunday, October 24, 2010
Best Buy Breakout Trade
TJX Co. Breakout Trade
I am looking to go long on the $TJX breakout above 45.40 with my 1st target at the June 16th high of 46.74; my 2nd target will be the June 3rd high of 47.34; and my 3rd target will be the April 26th high of 48.50. My stop loss will be below 44.35
Labels:
eqiuties,
investing,
market volatility,
stock charts,
stock trading,
stocks
Day trading US Steel short
Monday, July 12, 2010
$RIMM Sell Short
Sunday, July 11, 2010
WYNN sell short
Saturday, July 10, 2010
QCOM short for swing trade
Thursday, January 21, 2010
Google Has A Fibonacci Retracement Support Level at 540.30
Gold Futures
Gold Futures sold off today breaking breaking a trendline and the $1100.00 psychological support number briefly during Comex Pit trading. If gold takes out $1100.00 on Friday then look for the next major support at $1075.20 which was the December 2009 low after peaking at all time highs of $1227.50 on December 3, 2009.
Subscribe to:
Posts (Atom)